
Excerpt from Ryan, M.G., M.E. Harmon, R.A. Birdsey, C.P. Giardina, L.S. Heath, R.A. Houghton, R.B. Jackson, D.C. McKinley, J.F. Morrison, B.C. Murray, D.E. Pataki, and K.E. Skog. 2010. A Synthesis of the Science on Forests and Carbon for U.S. Forests. Issues in Ecology, Report Number 13, Spring 2010.
Forests store large amounts of carbon in their live and dead wood and soil and play an
active role in controlling the concentration of CO2 in the atmosphere (Figure 1). In the United States in 2003, carbon removed from the atmosphere by forest growth or stored in harvested wood products offset 12 to 19 percent of U.S. fossil fuel emissions (the 19 percent includes a very uncertain estimate of carbon storage rate in forest soil). Current U.S. forest growth rates are thought to be higher than those before European settlement because of recovery from past land use and disturbance, but these growth rate will not continue indefinitely.

Forest carbon storage differs from many other mechanisms that control atmospheric CO2 because forests have a life cycle during which carbon stocks, gains, and losses vary with forest age. Carbon enters a forest through photosynthesis, where leaves capture the energy in sunlight and convert CO2 from the atmosphere and water into sugars that are used to build new leaves, wood, and roots as trees grow (Figure 2). About half of the CO2 that is converted to sugars is respired by living trees to maintain their metabolism, and the other half produces new leaves, wood, and roots. As they grow, trees shed dead branches, leaves, and roots, and some of the trees die. Microorganisms decompose this dead material, releasing CO2 back to the atmosphere, but some of the carbon remains in the soil. Live and dead trees contain about 60 percent of the carbon in a mature forest, and soil and forest litter contain about 40 percent. The carbon in live and dead trees (50 percent of their biomass) varies the most with forest age.

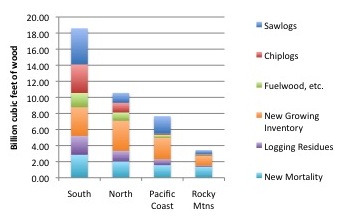
The carbon budget for forests varies across different regions. Based on data from the U.S.Forest Service Forest Inventory and Analysis program, it is possible to provide a current (circa 2006) snapshot of the carbon budgets for the four major timberland regions of the United States. About two-thirds of U.S. forests are defined as timberlands, which means that timber products can be legally harvested from them. Nontimberlands include parks, wilderness areas, and forests with low productivity. The three main annual carbon fluxes are 1) into products, 2) into the dead wood pool that slowly releases CO2 from microbial respiration, and 3) additions to the growing stock of the forests. Timberlands in the South and North regions produce a mix of products (sawlogs, pulplogs, and energy logs), while the Pacific Coast and Rocky Mountain regions produce mainly sawlogs with a small component of energy logs. Dead trees from natural mortality and logging residues represent a significant portion of the annual flux but release CO2 at a much faster rate than harvested products or the growing stock.
Related to Carbon Budgets:
- Forest Carbon Storage
- Carbon Balance in Forests
- Other Factors Influencing Forest Carbon Storage
- US Forest Carbon Policy
- Measuring Forest Carbon at Varying Scales
- Climate Change and Forest Carbon Storage